How to monitor Golden signals in Kubernetes

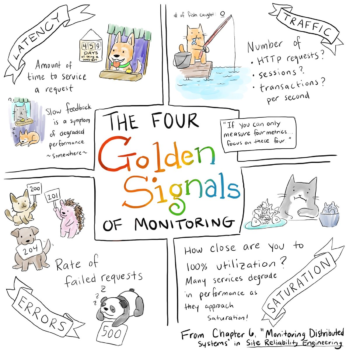
What are Golden signals metrics? How do you monitor golden signals in Kubernetes applications? Golden signals can help to detect issues of a microservices application.
These signals are a reduced set of metrics that offer a wide view of a service from a user or consumer perspective, so you can detect potential problems that might be directly affecting the behaviour of the application. Golden signals can help to detect issues of a microservices application. A guide into Golden signals metrics in #Kubernetes.
Congratulations, you have successfully deployed your application in Kubernetes. This is the moment you discover your old monitoring tools are pretty much useless and that you are not able to detect potential problems. Classic monitoring tools are usually based on static configuration files and were designed to monitor machines, not microservices or containers.
In the container world things change fast. Containers are created and destroyed at an incredible pace and it is impossible to catch up without specific service discovery functions. Most of the modern monitoring systems offer a huge variety of metrics for many different purposes.
It is quite easy to drown in metrics and lose focus on what is really relevant for your application. Setting too many irrelevant alerts can drive you to a permanent emergency status and “alert burn out.” Imagine a node that is being heavily used and raising load alerts all the time.
You are not doing anything about that as long as the services in the node work. Having too many alerts is as bad as not having any. Important alerts get masked in a sea of irrelevance.
Source: sysdig.com